
ISBN- 978-93-90972-89-0
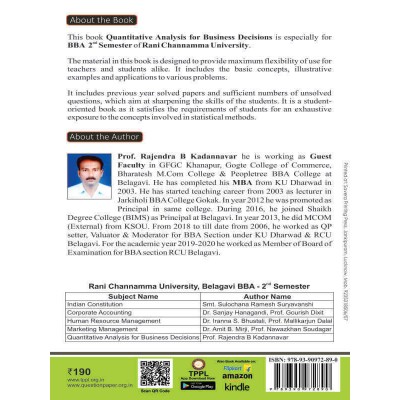
AUTHOR- Prof. Rajendra B Kadannavar
Tax excluded
ISBN- 978-93-90972-89-0
AUTHOR- Prof. Rajendra B Kadannavar
Syllabus
DSC-204- Quantitative Analysis for Business Decisions
Unit – I: Statistics 12 Hours
Definitions – Statistical Methods – Importance and Scope – Limitations – Need for Data – Principals of Measurement. Tabulation and Presentation:
Classification of Data – Data Array – Frequency Distribution – Methods of data Classification – Types of Frequency Distributions / Tabulation of Data – Objectives of Tabulation – Parts and Types of Tables – Graphical Presentation – Functions of Graphs – Advantages and Limitations of Graphs.
Unit – II: Measures of Central Tendency 12 Hours
Introduction to Averages – Requisites for a Measure of Central Tendency, Mean - Combined Mean – Weighted Mean, Median – Partition Values – Quartiles, Deciles and Percentiles, Relationship between Partition Values–Mode– Relationship between Mean, Median and Mode.
Unit – III: Measures of Dispersion 12 Hours
Introduction – Significance and Requisites of a Measure of Dispersion, Range, QD, MD and SD- For Grouped and Ungrouped – Advantages and Disadvantages. Concept of Variation – Coefficient of Variation. Skewness and Kurtosis (SK): Introduction, Measures of SK, Relative Measures of SK – Advantages and Disadvantages. Moments – concepts –Calculation – Kurtosis.
Unit – IV: Index Numbers 12 Hours
Index Numbers - Introduction – Types – Characteristics – Construction Weighted and Unweighted Index Numbers – Price and Quantity/Volume Index Numbers – Tests – Time Reversal – Factor Reversal and Circular Tests – Chain and Fixed Base – Changing of Base – Combining of Two of More Overlapping Indices Consumer Price Index – Problems in Construction.
Unit – V: Correlation Analysis 12 Hours
Scatter Diagram, Positive and Negative Correlation, Limits for Coefficient of Correlation, Karl Pearson’s Coefficient of Correlation, Spearman’s Rank Correlation.
Regression Analysis: Concept, Least Square Fit of a Linear Regression, Two Lines of Regression, Properties of Regression Coefficients (Simple Problems Only)
Time Series Analysis: Components, Models of Time Series – Additive, Multiplicative and Mixed Models; Trend Analysis- Free Hand Curve, Semi Averages, Moving Averages, Least Square Methods(Simple Problems only).